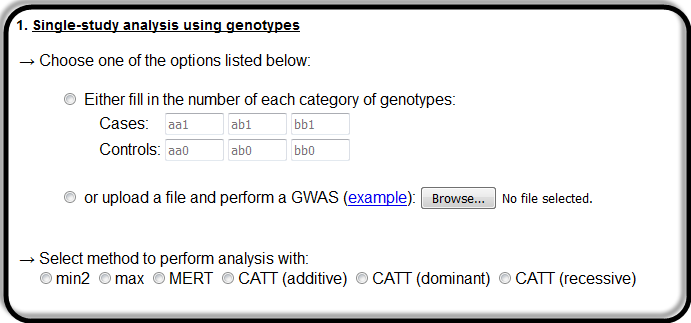
Figure 1. Single-study analysis options
GWAR performs standard analysis of genome-wide association studies (GWAS) using the
well-known Cochran-Armitage trend test (CATT) under any of the three available genetic
models of inheritance (Dominant, Recessive, Additive). Moreover, it can perform robust
analysis, which is more powerfull when the genetic model cannot be determined beforehand
(Bagos, 2013).
The available robust methods are: MAX, MIN2 and MERT.
* MERT is a linear combination of the two optimal tests for the extreme members of the family (in this case
the optimal CATTs for the recessive and dominant models) and it is distributed according
to a standard normal distribution
(Freidlin et al., 2002).
* The MAX test is based on the simple idea to test all three possible models and choose the one with the highest score
(Freidlin et al., 2002).
* MIN2 was applied by the investigators of the (WTCCC, 2007),
who considered the Pearson chi-square along with the CATT for the additive model and,
subsequently, chose the minimum of the p-values.
Apart from MERT, whose asymptotic distribution is easy to compute, MAX and MIN2 are
well-known for the difficulty in obtaining accurate p-values. Traditionally, simulations
are used, which, however, are time-consuming, particularly in large datasets with thousands
of SNPs. In GWAR, we have implemented two recently proposed methods that rely on numerical
integration. We use Gauss-Legendre quadrature, implemented in integrate using Mata, and
this results in great gain in computing time. For MAX, we implement the method proposed by
(Zhang et. al, 2010),
whereas, for MIN2, we implement the method proposed by
(Joo et. al, 2009).
Simulation results suggest that MIN2 is slightly less powerful (1-4%) than MAX for the
recessive model, it outperforms MAX under the additive model (by ~2%), whereas, for the
dominant model both tests perform similarly. MERT is less powerful compared to both MAX and
MIN2. We also need to point out that MIN2 is faster since it requires fewer calculations of
integrals.
GWAR can also perform meta-analysis using fixed-, and random-effects methods that use
summary data. The method uses weights equal to the sum of the reciprocal of the combined
cases and controls, as suggested by (Zhou et. al, 2011)
and ilustrated by (Bagos, 2013).
In this way, standard inverse-variance methods for meta-analysis can be used, including
random-effects methods.
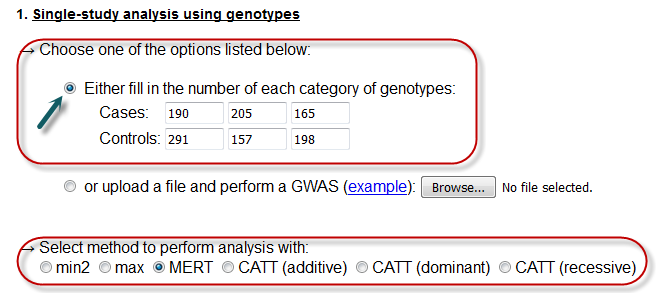
Here the user can perform a single-study analysis, by either inserting the 6 required numerical values in the textboxes, or by uploading a text file for batch search.
In this case, the user must fill the textboxes with positive, numerical values.
Further. he/she must select one of the available options for performing the analysis with.
Here, the variables aa0, ab0 and bb0 are the genotypes of the controls,
while the other ones (aa1, ab1 and bb1) are the genotypes of cases.
Allele b is assumed to be the risk variant.
Notice that one has to click in the radio button so that his/her choice is activated and select a method of analysis as well.
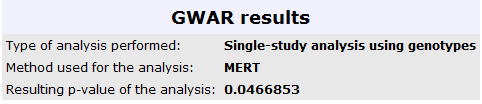
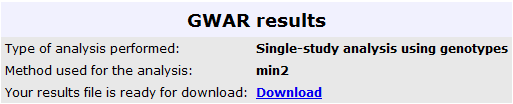
The results from this analysis can be seen in the image below:
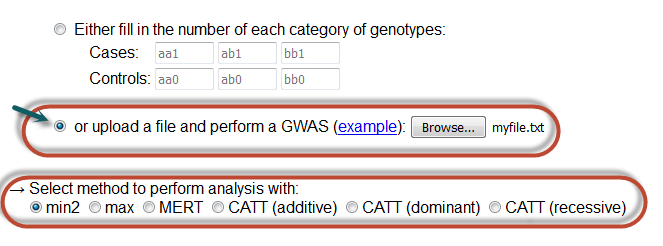
Single-study with file (batch search)
In this case, the user must upload a file with the corresponding values for batch analysis.
The file must have the following format:
  snp aa1 ab1 bb1 aa0 ab0 bb0
  rs1 40  587 1325  72  684 2180
  rs2 97  620 1100  88  579 1958
where, all values are separated by 1 horizontal tab.
Here, snp is the snp ID that is studied.
Please make sure that you follow the required format, else the program will NOT execute.
Notice that one has to click in the radio button so that his/her choice is activated and select a method of analysis as well.
The results from this analysis can be seen in the image below, where the user can retrieve the
results in a text file, for further analysis:
Here the user can perform a meta-analysis, by uploading a text file with the relevant information. Further. he/she must select one of the available options for performing the analysis with, as well as the type of the effect of the meta-analysis.
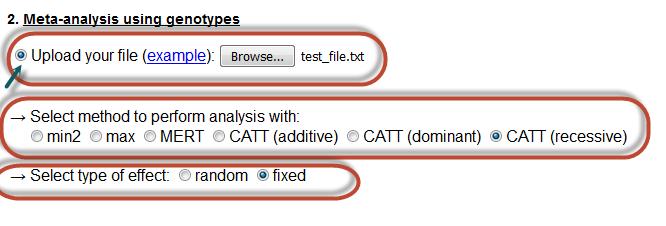
The uploaded file must have the following format:
  snp aa1 ab1 bb1 aa0 ab0 bb0
  rs111 40  587 1325  72  684 2180
  rs112 97  620 1100  88  579 1958
  rs113 110 97  845 69  224 845
  rs111 110 96  1230  63  777 1078
  rs112 963 441 67  126 897 903
where, all values are separated by 1 horizontal tab.
Here, snp is the snp ID that is studied.
Please make sure that you follow the required format, else the program will NOT execute.
Notice that one has to click in the radio button so that his/her choice is activated.
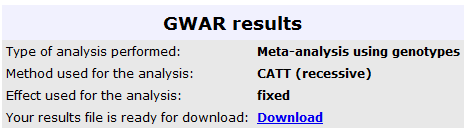
The results from this analysis can be seen in the image below, where the user can retrieve the
results in a text file, for further analysis:
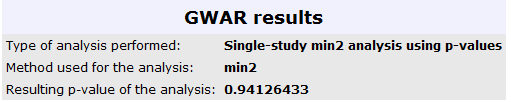
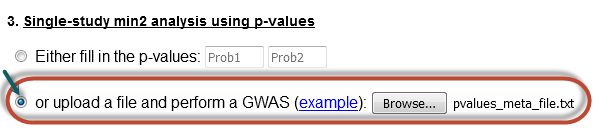
Here the user can perform a single-study analysis, by either inserting the 2 required p-values in the textboxes, or by uploading a text file for batch search.

Single-study min2 analysis with numbers
In this case, the user must fill the textboxes with positive p-values.
Here, the variable prob1 is the p-value obtained from a CATT under an additive model
and prob2 is the p-value obtained from a Pearson's chi-square statistic .
Notice that one has to click in the radio button so that his/her choice is activated and select a method of analysis as well.

The results from this analysis can be seen in the image below:
Single-study min2 analysis with file (batch search)
In this case, the user must upload a file with the corresponding values for batch analysis.
The file must have the following format:
  snp prob1 prob2 R S direction
  rs111 .0006912  .0015613  105 81  1
  rs112 .9330431  .8579313  80  100 1
  rs113 .43533  .2917903  717 515 -1
  rs111 .0208997  .0413771  180 193 1
  rs112 .0433624  .0722496  52  83  1
  rs113 .0150922  .0341846  108 104 1
  rs111 .0137216  .0476865  64  149 1
where, all values are separated by 1 horizontal tab.
Here, snp is the snp ID that is studied, R is the total number of cases
and S the total number of controls. direction is the direction of the effect.
Please make sure that you follow the required format, else the program will NOT execute.
Notice that one has to click in the radio button so that his/her choice is activated and select a method of analysis as well.
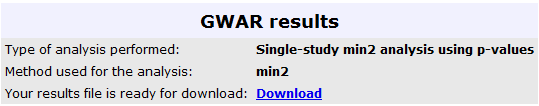
The results from this analysis can be seen in the image below, where the user can retrieve the
results in a text file, for further analysis:
Here the user can perform a min2 meta-analysis, by uploading a text file with the relevant information. Further. he/she must the type of the effect of the meta-analysis.
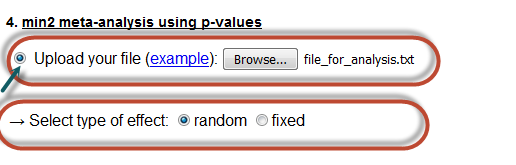
The uploaded file must have the following format:
  snp prob1 prob2 R S direction
  rs111 .0006912  .0015613  105 81  1
  rs112 .9330431  .8579313  80  100 1
  rs113 .43533  .2917903  717 515 -1
  rs111 .0208997  .0413771  180 193 1
  rs112 .0433624  .0722496  52  83  1
  rs113 .0150922  .0341846  108 104 1
  rs111 .0137216  .0476865  64  149 1
where, all values are separated by 1 horizontal tab.
Here, snp is the snp ID that is studied, R is the total number of cases
and S the total number of controls. direction is the direction of the effect.
Please make sure that you follow the required format, else the program will NOT execute.
Notice that one has to click in the radio button so that his/her choice is activated.
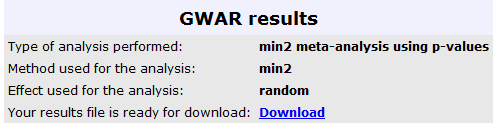
The results from this analysis can be seen in the image below, where the user can retrieve the results in a text file, for further analysis:
You can download GWAR to run locally on your machine.
A help is also available on how to run it using Stata.
For questions regarding the software, please contact Dr. Bagos at pbagos compgen.org directly.

In all cases of searches, the user can provide his/her e-mail, so as to be notified once the results are ready. This is strongly encouraged in large batch submissions of data.